How to Measure Trade Expectancy and Improve Strategy Performance
Understanding Trade Expectancy
Trade expectancy is a foundational performance metric that quantifies the average amount a trader can expect to gain or lose per trade over a large sample. Rather than focusing on a single outcome, trade expectancy evaluates results collectively, allowing traders to assess whether their strategy produces a statistical edge. In practical terms, it answers a direct question: If I continue trading this system under similar conditions, what is the average return per trade I can expect?
Many traders concentrate heavily on win rates or on the size of individual profits. However, a high win rate does not necessarily indicate profitability, nor does a low win rate imply failure. Trade expectancy integrates both probability and magnitude, offering a balanced perspective. It forms the quantitative basis for decision-making, risk control, and long-term growth planning.
A trading strategy with a positive expectancy suggests that, over time and with sufficient repetition, gains should exceed losses. Conversely, a negative expectancy indicates that losses will likely accumulate if the strategy remains unchanged. Understanding this metric shifts the focus from isolated trades to long-term statistical consistency.
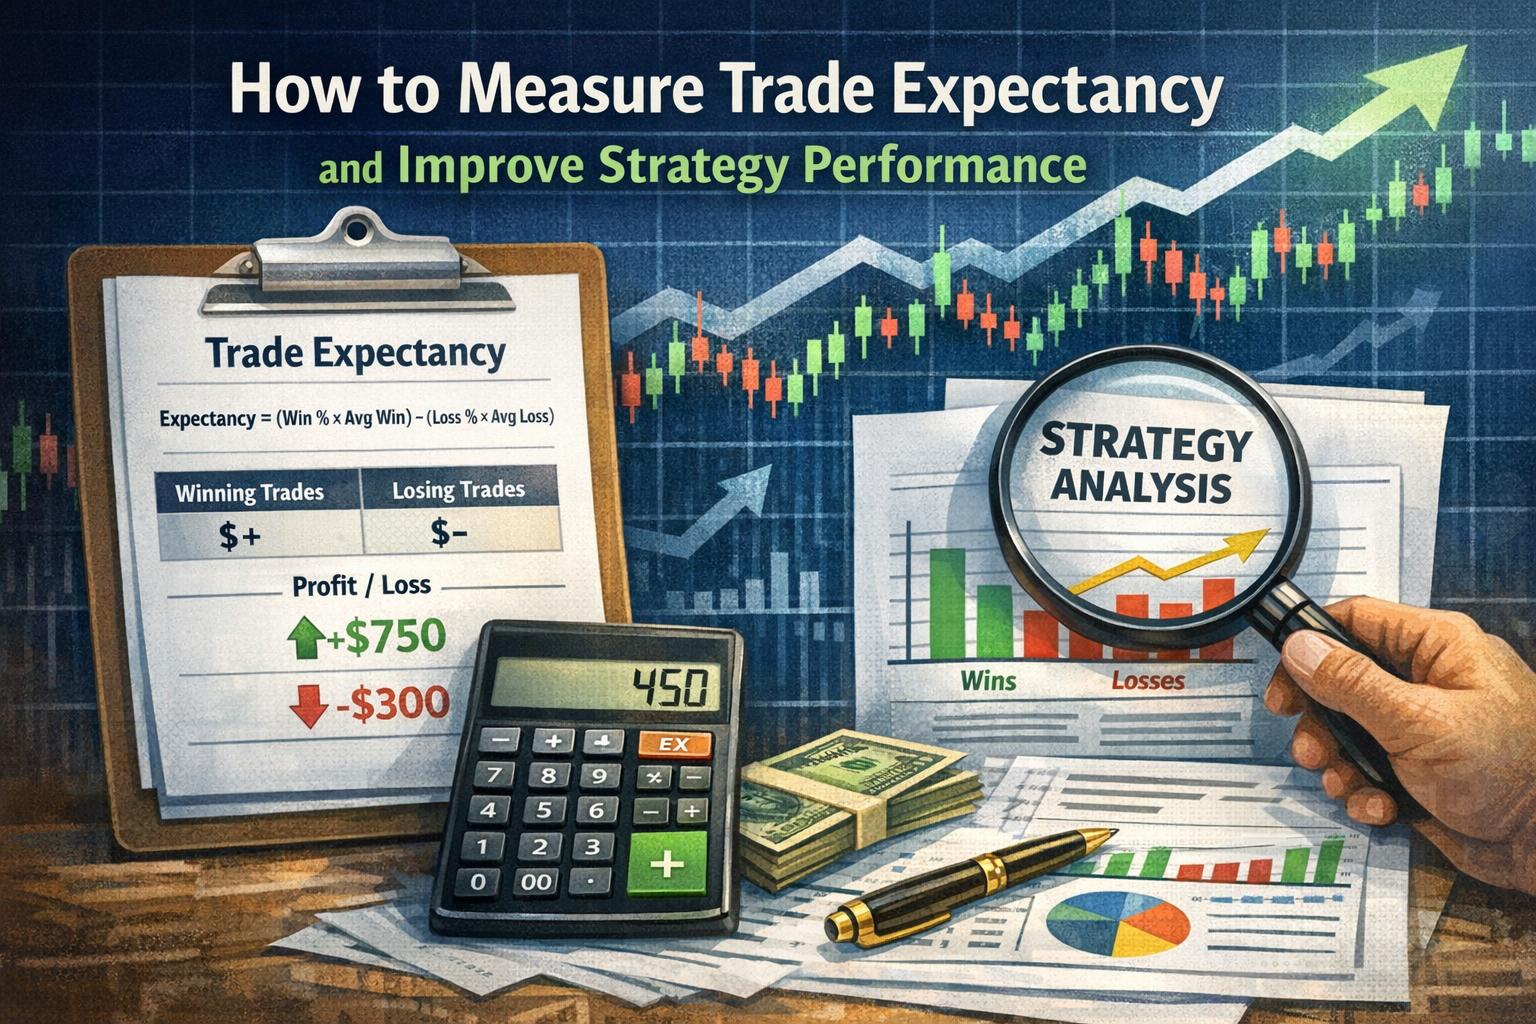
Formula for Trade Expectancy
To compute trade expectancy, use the formula:
Trade Expectancy = (Probability of Winning x Average Win) - (Probability of Losing x Average Loss)
This formula calculates the weighted average outcome of all trades. It incorporates both how often trades win or lose and how much is gained or lost in each scenario. The result represents the average expected return per trade.
For example, if a strategy wins 50% of the time with an average gain of $200, and loses 50% of the time with an average loss of $150, the calculation would be:
Trade Expectancy = (0.50 × 200) − (0.50 × 150)
Trade Expectancy = 100 − 75
Trade Expectancy = $25 per trade
This means that, on average, each trade is expected to yield $25 in profit over a large sample of trades.
Interpreting the Result
A positive result indicates a statistical edge. A zero result indicates a break-even system before transaction costs. A negative value suggests that the strategy, in its present form, is likely to lose money over time.
It is essential to remember that expectancy does not guarantee results in the short term. Variability is inherent in trading. Even a system with strong positive expectancy may experience losing streaks. Expectancy reflects long-term probability, not immediate certainty.
Key Components Explained
Probability of Winning refers to the ratio of profitable trades to the total number of trades. If a trader completes 100 trades and 55 are profitable, the probability of winning is 0.55 or 55%. This value is derived from historical performance data and should be calculated from a sufficiently large sample size to ensure statistical reliability.
Average Win is the mean profit from winning trades. It is calculated by adding all profitable outcomes and dividing by the number of winning trades. This metric reflects how much value is captured when the strategy performs correctly.
Probability of Losing represents the ratio of losing trades to total trades. In most systems, this is simply 1 minus the probability of winning, assuming every trade closes as either a win or a loss.
Average Loss measures the mean decline incurred per losing trade. It is calculated by summing all losses and dividing by the number of losing trades. This component plays a decisive role in risk control because even a small increase in average loss can significantly reduce expectancy.
The Relationship Between Win Rate and Risk-Reward
Trade expectancy highlights the dynamic relationship between win rate and risk-reward ratio. A system with a high win rate but small average wins relative to losses may still have negative expectancy. Conversely, a strategy with a lower win rate but significantly larger average wins can remain highly profitable.
For example, a system that wins 40% of the time but achieves gains three times larger than its losses can maintain strong positive expectancy. This demonstrates that profitability is not solely dependent on frequency of success but also on magnitude of outcomes.
Understanding this balance prevents common errors, such as prioritizing win rate at the expense of risk discipline. Traders who attempt to increase win rates by widening stop-loss levels may inadvertently enlarge their average loss, thereby reducing overall expectancy.
Sample Size and Statistical Reliability
The reliability of trade expectancy depends heavily on sample size. A small number of trades may produce distorted results due to randomness. Calculating expectancy from ten trades provides limited insight. Calculating from two hundred trades offers greater statistical confidence.
Markets are variable environments. Conditions evolve due to economic cycles, liquidity changes, regulatory adjustments, and behavioral shifts among participants. Therefore, trade expectancy should be recalculated periodically to confirm that the strategy maintains its edge.
A large sample size reduces the influence of outliers. A single exceptionally profitable or severe losing trade can skew results when few data points are available. Over time, as the number of trades increases, averages tend to stabilize and reflect true performance characteristics.
Enhancing Strategy Performance Using Trade Expectancy
Once trade expectancy has been quantified, it can serve as a practical diagnostic tool. Instead of modifying strategies based on isolated losses or gains, traders can adjust individual variables within the expectancy formula to improve overall performance.
Improvement generally occurs through increasing the average win, reducing the average loss, increasing win probability, or a combination of these changes. Each adjustment must be tested systematically to ensure that other components are not negatively affected.
Optimizing Risk-Reward Ratios
The risk-reward ratio compares the potential gain of a trade to its potential loss. Maintaining a risk-reward structure where average gains exceed average losses can substantially improve trade expectancy.
If a trader consistently risks $100 to make $200, the system requires a win rate of only 34% to break even before costs. This illustrates how structured reward targets can compensate for modest win rates.
However, excessively large profit targets may reduce win probability. Therefore, optimization requires balancing trade completion rates with realistic market conditions. Adjustments should be based on empirical testing rather than assumptions.
Improving Trade Selection
Win probability can often be enhanced by refining entry criteria. This might involve incorporating additional confirmation signals, filtering trades based on volatility conditions, or aligning entries with broader market trends.
Improving trade selection does not necessarily mean increasing trade frequency. In some cases, filtering marginal setups results in fewer trades but higher overall expectancy. A reduction in low-quality entries can increase average win and probability of success simultaneously.
Cutting Losses Short
Controlling average loss is one of the most direct methods of protecting expectancy. Since average loss is a subtractive component in the formula, limiting downside exposure improves net outcome even if win rate remains constant.
Implementing predefined stop-loss levels enforces discipline. Consistent execution prevents small losses from expanding into disproportionately large ones. When stop-loss policies are adhered to consistently, the average loss remains stable and predictable.
Moving stop-loss levels during trades can distort statistical structure. A strategy is designed with specific assumptions about loss size. Deviating from those parameters alters expectancy calculations and often reduces the statistical edge.
Transaction Costs and Slippage
Expectancy calculations must account for commissions, spreads, and slippage. Even a strategy with marginally positive expectancy can become negative once transaction costs are deducted.
For example, if calculated expectancy is $10 per trade but brokerage fees average $8 per trade, the effective expectancy falls to $2. Minor inefficiencies can therefore materially affect profitability, especially in high-frequency systems.
Accurate record keeping should include all trading expenses. Traders operating in markets with wide spreads or high commissions must ensure that their gross expectancy exceeds these structural costs by a sufficient margin.
Expectancy and Position Sizing
Trade expectancy identifies whether a strategy has an edge, but position sizing determines how that edge translates into account growth. Even a positive expectancy system can lead to losses if position sizes are too large relative to capital.
Risk per trade should remain consistent with capital preservation principles. Many traders risk a fixed percentage of account equity on each trade. This approach maintains proportional exposure and minimizes the probability of catastrophic loss.
Position sizing models, such as fixed fractional methods, can be integrated with expectancy data to project long-term growth scenarios. By combining average return per trade with disciplined exposure limits, traders can estimate potential equity curves under realistic conditions.
Psychological Implications of Expectancy
Understanding expectancy also supports decision-making discipline. Traders who recognize that profitability arises from long-term averages may be less influenced by short-term outcomes. This statistical perspective encourages adherence to predefined rules.
Trading systems inevitably experience drawdowns. Expectancy analysis helps contextualize these events by showing whether losses remain within the historical distribution of outcomes. If expectancy remains stable, temporary underperformance may not require structural changes.
Conversely, sustained deterioration in expectancy may signal that the strategy is no longer aligned with current market behavior. Distinguishing between normal variance and systemic decline is an essential skill.
Regular Performance Review
Periodic evaluation of trade logs ensures that expectancy remains aligned with strategic objectives. Traders should monitor changes in win rate, average win, and average loss separately. Identifying which component has shifted allows for targeted improvements.
Market environments evolve over time. Strategies designed for high-volatility conditions may perform differently during low-volatility periods. Regular recalculation of expectancy helps determine whether adaptation is required.
Maintaining detailed records, including entry rationale and exit execution, supports objective review. Decisions should be guided by measured data rather than short-term reactions.
Expectancy Across Different Trading Styles
Expectancy principles apply universally across trading styles, including intraday trading, swing trading, and long-term position trading. The primary difference lies in time horizon and trade frequency.
Short-term traders often execute many trades with smaller average gains, relying on repetition to accumulate returns. Long-term traders may execute fewer trades with larger average profit targets. In both approaches, expectancy remains the central measure of system viability.
Strategies in highly liquid markets may have smaller average returns but lower transaction costs, while less liquid markets may offer larger margins but higher slippage. Expectancy calculations must reflect these structural characteristics.
Stress Testing and Scenario Analysis
Advanced traders may extend expectancy analysis through stress testing. This involves evaluating how changes in win rate or average loss affect overall performance.
For instance, calculating expectancy under slightly reduced win probability can reveal how sensitive a strategy is to declining accuracy. If minor changes convert positive expectancy into negative results, the system may lack robustness.
Scenario analysis allows traders to evaluate worst-case historical drawdowns and compare them with projected outcomes based on expectancy. This prepares traders for realistic fluctuations in performance.
Further Learning and Tools
Modern trading platforms often provide built-in performance analytics that automatically calculate expectancy and related metrics. Spreadsheet software can also be used to compute and visualize results.
Backtesting tools allow traders to simulate strategies over historical data to estimate potential expectancy before deploying real capital. However, historical testing should account for changing conditions and realistic transaction costs.
Educational development in statistics, probability theory, and risk management can deepen understanding of expectancy. A structured analytical approach supports consistent strategy refinement.
Conclusion
Trade expectancy serves as the quantitative foundation of systematic trading. By integrating win probability with average reward and risk, it provides a clear measure of whether a strategy holds a statistical advantage. It shifts focus from isolated outcomes to long-term performance potential.
Through disciplined record keeping, structured risk control, and periodic recalculation, traders can use expectancy to refine strategies and maintain alignment with evolving markets. A positive expectancy does not eliminate variability, but it establishes the necessary condition for sustainable profitability.
When combined with prudent position sizing, transaction cost awareness, and consistent execution, trade expectancy becomes more than a calculation. It becomes a framework for objective decision-making and long-term performance evaluation.
This article was last updated on: March 29, 2026