Understanding Candlestick Patterns and Their Importance
Candlestick Patterns Overview
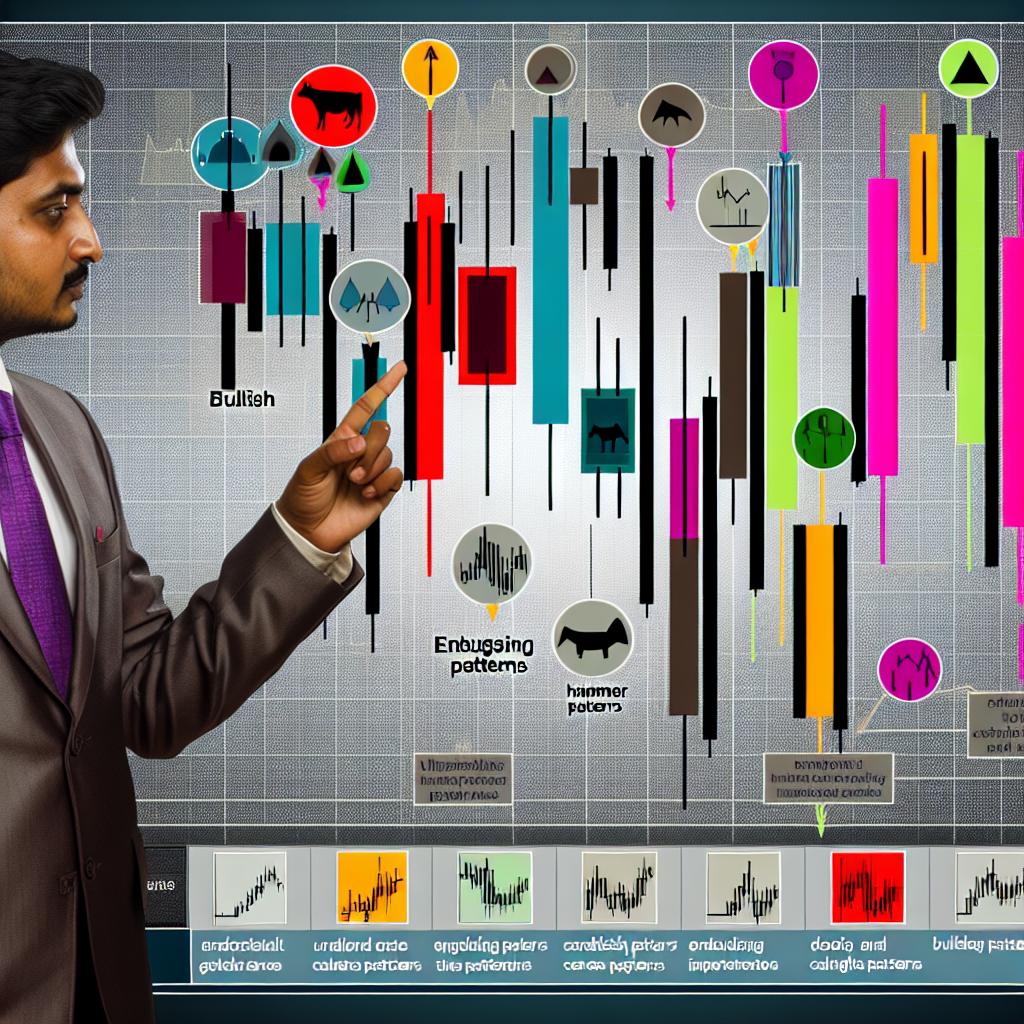
Candlestick patterns are a crucial tool for traders and investors in the financial markets. Originating in Japan in the 18th century, these chart formations are used to predict market movements by analyzing past price movements. Unlike simpler bar graphs, candlestick charts offer a more detailed view by displaying the open, close, high, and low prices for a specific period.
Structure of a Candlestick
Each candlestick consists of a body and two wicks, often referred to as shadows. The body represents the open and close prices, while the wicks indicate the highest and lowest prices during the given time frame. The color of the candle reflects market direction: typically, a green candle indicates a price increase, and a red candle signifies a price decrease.
Interpreting Candlestick Patterns
Candlestick patterns can be categorized into two main types: reversal patterns and continuation patterns. Reversal patterns signal a change in the market trend, whereas continuation patterns indicate that the current trend is likely to persist.
Reversal Patterns
One of the most significant reversal patterns is the Doji, which forms when the open and close prices are very close to one another. This indicates market indecision and a potential reversal. The Doji pattern is essential for traders because it signals that the previous trend may come to an end. Another important reversal pattern is the Engulfing Pattern. This pattern occurs when a smaller candle is followed by a larger one that completely engulfs the former, indicating a potential shift in the trend. An Engulfing Pattern can be either bullish or bearish. In a bullish Engulfing Pattern, a small red candle is followed by a large green candle, showing a potential beginning of an uptrend. Conversely, in a bearish Engulfing Pattern, a small green candle is followed by a large red candle, signaling a possible turn to a downtrend.
Continuation Patterns
In contrast, continuation patterns like the Rising Three Methods and Falling Three Methods suggest that the prevailing trend will continue. The Rising Three Methods pattern involves a long white (or green) candle followed by a series of smaller opposing candles and then another long white (or green) candle. This sequence indicates that the prior uptrend will likely persist after a short pause. On the other hand, the Falling Three Methods pattern consists of a long black (or red) candle, a series of smaller opposite candles, and another long black (or red) candle, indicating a pause before continuing the downtrend. These patterns involve a brief counter-trend move that is followed by a continuation of the original trend.
The Importance of Candlestick Patterns
Understanding and interpreting candlestick patterns is vital for traders, as it aids in making informed decisions. By analyzing these patterns, traders can potentially identify market entry and exit points, minimizing risks and maximizing returns. These patterns not only help in spotting potential turning points in the market but also give traders the confidence to follow trends. Furthermore, candlestick patterns are applicable across various markets, including stocks, forex, and commodities, making them a versatile tool for different trading environments.
When used in combination with other technical analysis tools, candlestick patterns can provide additional confirmation of patterns or reversals, leading to better-informed trading choices. Traders often use candlestick patterns along with volume analysis, moving averages, and other indicators to increase the reliability of their trading signals. This multi-faceted approach can help traders interpret market dynamics more accurately and enhance their decision-making process.
Additionally, many financial resources are available that delve deeper into candlestick patterns, offering insights into how to incorporate these formations into a trading strategy. For those eager to deepen their understanding, these resources can provide detailed examples and case studies, illustrating the application of these patterns in various trading scenarios. For more in-depth information, consider visiting trusted financial websites that specialize in technical analysis.
Beyond the individual patterns, understanding the context in which these patterns form is also crucial. Market conditions, overall trends, and other external factors should be considered when analyzing candlestick formations. Traders should be aware that these patterns, while powerful, do not always guarantee specific price movements. They are most effective when used as part of a comprehensive trading strategy that incorporates various elements of technical and fundamental analysis.
While candlestick patterns are a valuable tool, they are most effective when combined with other analytical methods and market indicators. For instance, support and resistance levels are commonly used alongside candlestick patterns to pinpoint potential price targets. This integrated approach provides a comprehensive view of market dynamics, enhancing decision-making accuracy. Additionally, understanding the timeframe within which these patterns form is crucial, as patterns on longer timeframes such as daily or weekly charts tend to hold more significance than those on shorter timeframes like minute or hourly charts.
In conclusion, candlestick patterns offer a visual and effective way to understand market psychology and predict future price movements. They serve as a versatile tool for traders and investors alike, providing insights into market trends and potential reversals. By mastering these patterns and integrating them with other analytical methods, traders can enhance their analysis and make more confident trading decisions, ultimately working towards minimizing risks and maximizing potential rewards in the dynamic environment of financial markets.
This article was last updated on: June 1, 2025