How to Use ATR for Volatility-Based Trade Planning
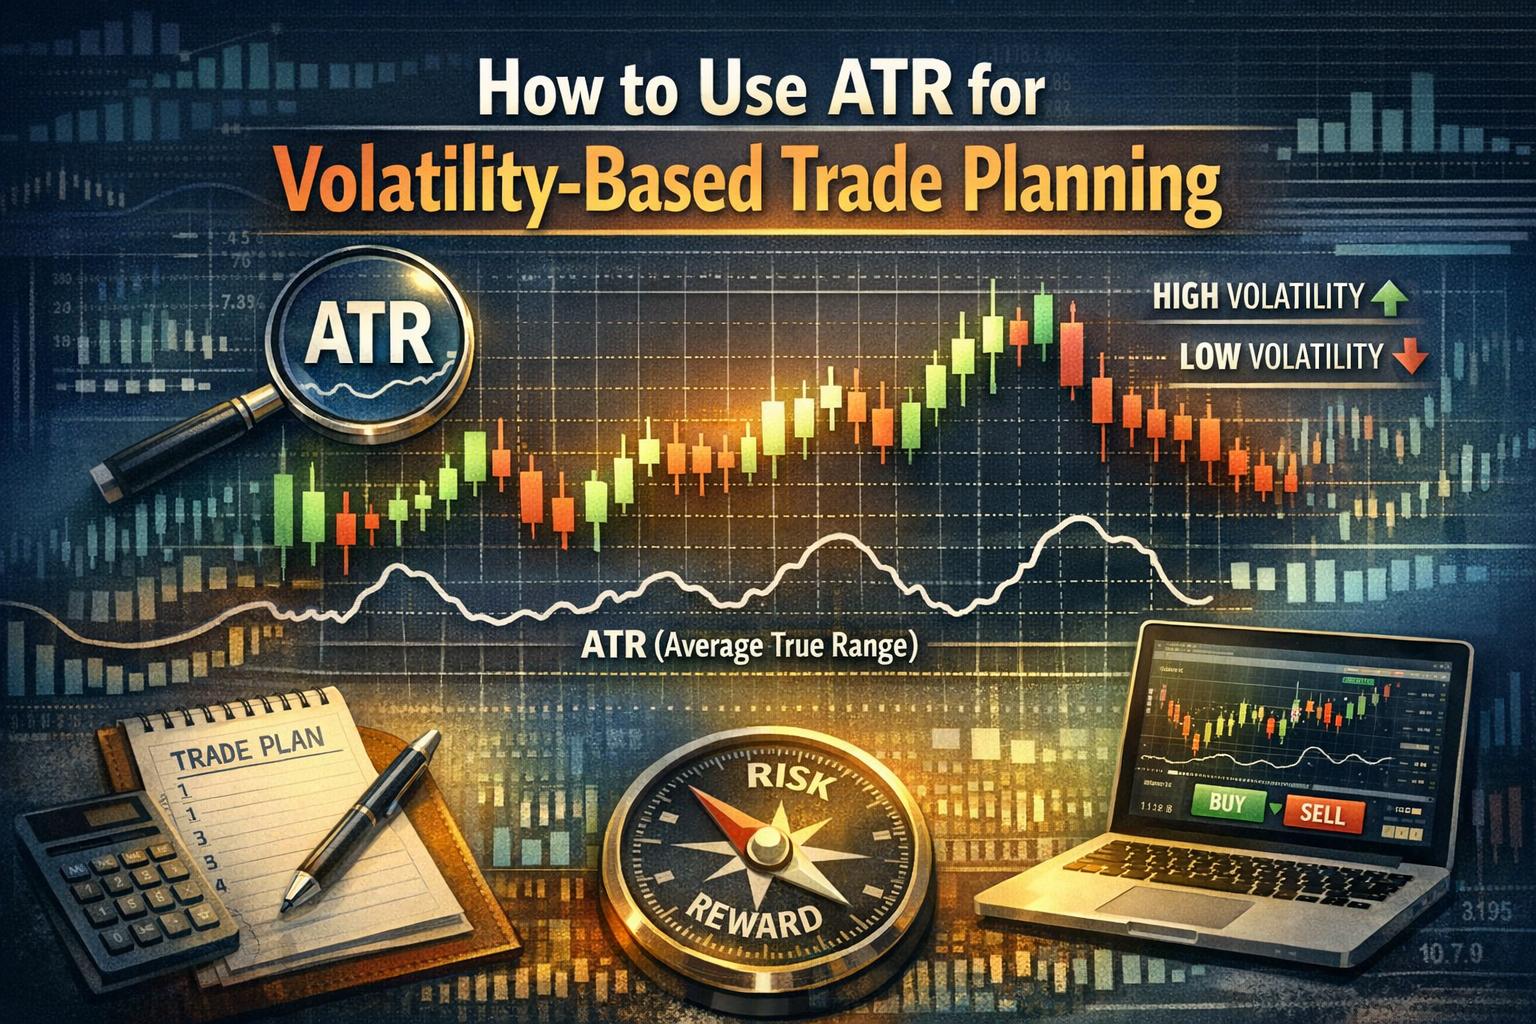
Understanding Average True Range (ATR)
The Average True Range (ATR) is a widely recognized technical analysis indicator designed to measure market volatility. Developed by J. Welles Wilder Jr. and introduced in his 1978 book New Concepts in Technical Trading Systems, the ATR was initially created for use in commodities markets. Over time, however, it has been adopted across equities, indices, exchange-traded funds, cryptocurrencies, and foreign exchange markets. Its broad application stems from its simplicity and its focus on measuring the magnitude of price movement rather than price direction.
ATR differs fundamentally from momentum or trend-following indicators. It does not indicate whether a market is trending upward or downward. Instead, it reflects how much price is moving within a given time frame. By concentrating on the range between high and low prices and incorporating price gaps, ATR provides traders with a consistent method of assessing volatility across different market conditions.
Volatility is a central concept in trading and investing. High volatility typically implies larger price swings and greater uncertainty, while low volatility reflects relatively stable price action. Understanding volatility allows traders to manage risk more effectively and adjust their strategies to prevailing market conditions. ATR serves as a practical, standardized measure of this volatility.
Historical Context and Purpose
Wilder developed ATR in response to the specific challenges of commodities trading, where price gaps were common due to daily price limits and significant overnight developments. Traditional range calculations that considered only the difference between the daily high and low failed to account for gaps between sessions. Wilder’s introduction of the True Range (TR) addressed this limitation by incorporating previous closing prices into the calculation.
Although financial markets have evolved since ATR’s creation, price gaps and volatility remain central concerns. Earnings announcements, geopolitical events, economic data releases, and unexpected news can all lead to sudden expansions in trading ranges. ATR captures these dynamics without requiring complex statistical formulas.
Calculating ATR
The ATR calculation involves two stages. The first step is determining the True Range (TR) for each period. The True Range represents the greatest of the following three values:
The difference between the current high and the current low; the absolute value of the current high minus the previous close; or the absolute value of the current low minus the previous close.
This approach ensures that gaps between periods are reflected in the volatility measurement. For example, if a stock closes at 100 and opens the next day at 105 before trading within a narrow range, the traditional high-low calculation may underestimate actual volatility. The True Range corrects for this by incorporating the previous close into the computation.
After calculating the True Range for each period, the ATR is derived as an average of these TR values. Wilder originally used a smoothed moving average formula that resembles an exponential moving average. In practice, many charting platforms continue to apply Wilder’s smoothing method, while others use standard exponential moving averages. The most common lookback period is 14 bars, though traders frequently adjust this setting based on their strategies and timeframes.
Period Selection and Its Implications
The chosen lookback period directly influences the sensitivity of the ATR. A shorter period, such as 7 days, will cause the ATR to respond more quickly to recent volatility changes. A longer period, such as 20 or 30 days, smooths out short-term fluctuations and reflects broader volatility trends.
Day traders may prefer shorter settings on intraday charts to capture rapid changes in volatility. Position traders and long-term investors often use longer periods on daily or weekly charts for a more stable reading. The choice of period should align with the trading horizon and the asset’s typical behavior.
Interpreting ATR Values
An increasing ATR indicates expanding market volatility. Price bars may become longer, and intra-period swings may grow more pronounced. A decreasing ATR signals contracting volatility, characterized by narrower trading ranges and reduced price dispersion.
Importantly, ATR values are relative rather than absolute indicators. A reading of 2.0 may represent high volatility for one asset and low volatility for another, depending on price scale and normal trading behavior. For meaningful interpretation, ATR values should be compared to historical values of the same instrument.
ATR does not predict direction. A rising ATR during a price decline does not imply a reversal; it simply indicates that price movements are becoming larger. Traders therefore combine ATR with directional indicators or price action analysis to form more comprehensive strategies.
ATR as a Tool for Setting Stop-Losses
One of the most practical applications of ATR is in determining stop-loss levels. Stop-loss placement is central to risk management, and volatility-based methods offer an adaptive alternative to fixed-percentage stops.
Markets do not move in uniform increments. A stop-loss set at a fixed distance may be too narrow in a volatile environment, leading to premature exits. Conversely, the same stop may be unnecessarily wide during stable periods, increasing potential loss relative to expected movement. ATR-based stop placement adjusts dynamically to current market conditions.
Using ATR Multiples
A common approach involves placing stop-loss orders at a multiple of the ATR away from the entry price. The selected multiple depends on the trader’s strategy, timeframe, and tolerance for price fluctuation. Short-term traders may use smaller multiples, such as 1 to 1.5 times the ATR. Longer-term traders often use 2 to 3 times the ATR to avoid being stopped out by routine market noise.
For example, if a stock’s ATR is 1.5 and a trader uses a multiple of 2, the stop distance would be 3 points from the entry price. In a long position, the stop would be set below the entry; in a short position, above it. This method ensures that the stop reflects the asset’s recent trading behavior rather than arbitrary distance.
Example of Setting a Stop-Loss
Suppose a trader enters a long position at 50, and the ATR is 1.5. Using a 2× multiple, the stop-loss would be placed 3 points below the entry at 47. If volatility increases and the ATR later rises to 2.0, a similar new trade might require a 4-point stop if the same multiple is applied.
Some traders also use ATR in trailing stop systems. As price moves in favor of the position, the stop is adjusted based on the current ATR and the highest favorable price achieved. This ensures that exits remain proportionate to ongoing volatility.
ATR Use in Position Sizing
Beyond stop placement, ATR plays a key role in position sizing. Effective position sizing aligns trade risk with account size and market volatility. Without such calibration, traders risk exposing too much capital during volatile periods or underutilizing capital during stable periods.
Calculating Position Size
To calculate position size using ATR, a trader first determines the acceptable percentage of total equity to risk on a single trade. This risk percentage often ranges between 0.5% and 2%, depending on the trading style and capital base.
After determining the monetary risk amount, the trader divides that amount by the stop distance derived from the ATR. The result indicates how many shares, contracts, or units can be traded without exceeding the predetermined risk threshold.
For instance, if an account balance is 10,000 and the trader is willing to risk 1% per trade, the maximum risk is 100. If the ATR is 2 and the stop is placed 2 ATRs away, the total stop distance is 4. Dividing 100 by 4 yields 25 units. This approach harmonizes trade size with volatility.
Example of Position Sizing
Consider a trader with 10,000 in capital and a 1% risk limit per trade. The trader identifies an opportunity in a stock with an ATR of 2. If the strategy calls for a stop at 1 ATR from entry, the stop distance equals 2. Dividing the allowable 100 risk by 2 results in a position size of 50 shares.
If the same stock’s ATR increases to 4, maintaining the same risk limit and stop multiple would reduce the allowable position to 25 shares. In this way, ATR naturally scales exposure downward during periods of heightened volatility.
Identifying Breakouts and Consolidations
ATR also assists in recognizing shifting market conditions. Changes in volatility frequently precede or accompany structural market developments such as breakouts and consolidations.
Spotting Breakouts
A sustained increase in ATR following a prolonged period of low readings may signal the start of a breakout. Consolidation phases are often characterized by compressed price ranges and reduced ATR values. When volatility expands and price moves beyond established support or resistance levels, breakout traders may interpret the combination as confirmation of renewed activity.
Although ATR does not indicate direction, its expansion during price movement can validate that a breakout is supported by sufficient volatility. A breakout attempt accompanied by flat or declining ATR may suggest limited participation.
Recognizing Consolidations
Decreasing ATR values indicate diminishing volatility. Markets in consolidation typically exhibit narrowing price ranges and reduced momentum. Such environments may persist until new information or participation triggers an expansion in activity.
By monitoring ATR contraction, traders can identify markets transitioning into equilibrium phases. Some strategies specifically target low-volatility environments in anticipation of future expansion, while others avoid trading during contraction due to reduced opportunity.
Comparing ATR Across Instruments
Because ATR is expressed in price units rather than percentages, direct comparisons between different assets require contextual interpretation. A 3-point ATR may represent significant volatility for a 20 stock but minimal volatility for a 500 stock. To compare assets more directly, some traders convert ATR to a percentage of price by dividing the ATR value by the current price.
This normalized approach allows investors to evaluate relative volatility across instruments, sectors, or asset classes. Portfolio managers may use such comparisons when allocating capital among multiple opportunities.
Limitations of ATR
Despite its usefulness, ATR has limitations. It is a lagging indicator because it relies on historical price data. Sudden events may cause volatility to change rapidly before the ATR fully reflects the shift. Traders should therefore use ATR in conjunction with other analytical tools rather than as a standalone decision-making metric.
Additionally, ATR does not account for underlying fundamentals, liquidity conditions, or macroeconomic context. In thinly traded markets, sporadic price jumps may distort readings. Understanding the characteristics of the specific instrument being traded remains essential.
Conclusion
The Average True Range remains a foundational tool in technical analysis due to its clarity and adaptability. By focusing exclusively on price range, it provides a consistent measure of volatility across diverse markets and timeframes. Traders use ATR to determine appropriate stop-loss distances, calculate position sizes, assess breakout conditions, and evaluate periods of consolidation.
Its strength lies in its objectivity. ATR does not forecast direction or generate trading signals by itself. Instead, it informs risk management and strategic planning. When integrated with broader analytical frameworks, ATR helps ensure that trading decisions account for the prevailing level of market volatility.
This article was last updated on: April 16, 2026