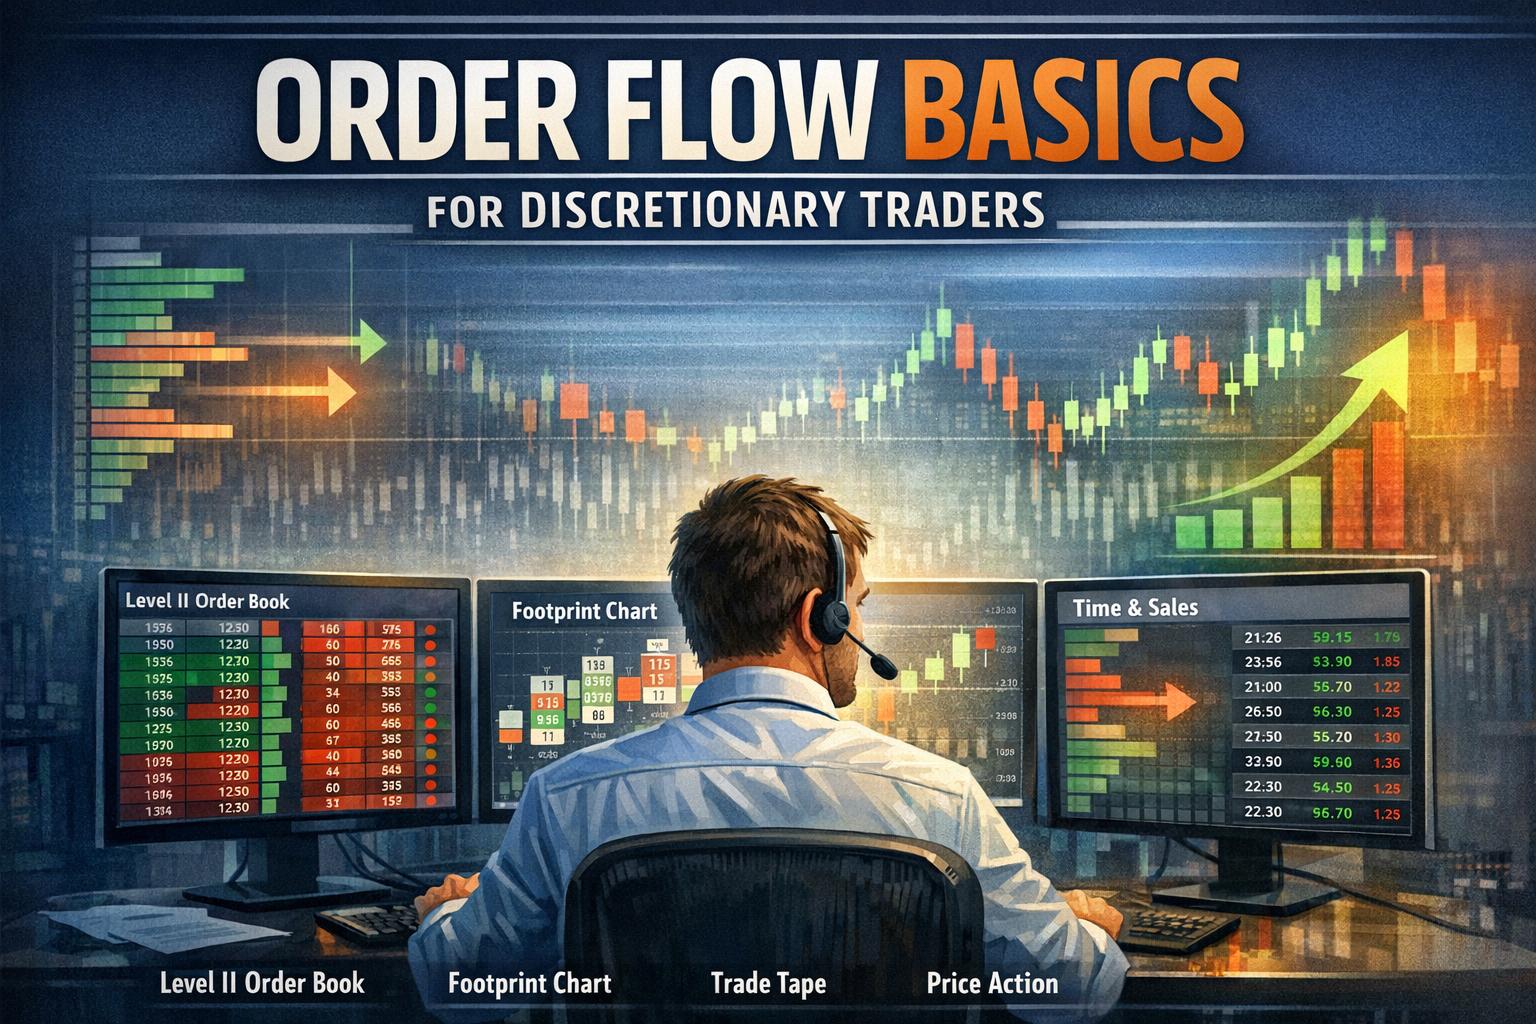
Order Flow Basics for Discretionary Traders
Understanding Order Flow
Order flow refers to the continuous stream of buy and sell instructions submitted to a financial exchange and the way those instructions interact to produce executed trades and price changes. In modern electronic markets, every fluctuation in price is the result of an order being matched with another order. By examining this process in detail, traders can gain insight into the mechanics that drive short-term and long-term price movement.
For discretionary traders, who rely on judgment rather than purely systematic rules, order flow offers a direct view into market activity. Instead of focusing solely on completed price bars or lagging indicators, order flow analysis studies the underlying transactions that form those bars. This perspective shifts attention from historical summaries to real-time interactions between participants. Such information can clarify whether price movements are supported by strong participation or are occurring on relatively light activity.
Understanding order flow requires familiarity with how exchanges match buyers and sellers, how liquidity is provided and consumed, and how different types of participants engage in the market. Institutional investors, retail traders, market makers, and algorithmic systems all contribute to the collective flow of orders. By observing patterns in how orders enter and leave the market, traders can interpret shifts in supply and demand as they unfold.
The Basics of Order Flow
At its foundation, order flow analysis focuses on the distinction between different order types and their interaction. The two primary order types are market orders and limit orders. Market orders are instructions to buy or sell immediately at the best available price. They consume liquidity because they are matched against resting orders already sitting in the order book. Limit orders, by contrast, specify a price at which the trader is willing to transact. These orders provide liquidity by waiting in the order book until a market order or compatible limit order matches them.
When a market order is submitted, it may fill entirely at one price level or sweep through multiple price levels if sufficient liquidity is not available at the best bid or ask. This interaction directly influences price movement. If aggressive buying via market orders absorbs all available sell limit orders at the current ask, price will move upward to the next level where sell orders are available. The reverse occurs when aggressive selling overwhelms buy limit orders.
This distinction between passive liquidity providers and aggressive liquidity takers is central to interpreting order flow. Price tends to move when one side becomes more aggressive or when liquidity on the opposing side becomes thin. A balanced flow of buying and selling activity may result in relatively stable prices, whereas an imbalance can produce strong directional moves.
Another aspect of order flow basics involves the concept of trade initiation. Although each transaction requires both a buyer and a seller, it is possible to classify trades according to which side initiated the transaction. If a trade occurs at the ask price, it is generally considered buyer-initiated because the buyer crossed the spread to transact. If it occurs at the bid, it is considered seller-initiated. Tracking this information provides insight into whether buyers or sellers are exerting short-term control.
Reading the Order Book
The order book, sometimes referred to as Level II data or the depth of market, displays pending limit orders organized by price level. On one side are bids, representing buy orders, and on the other side are asks, representing sell orders. Each level shows the quantity of contracts or shares available at that price.
Reading the order book involves more than observing static quantities. Because orders can be added, canceled, or modified at high speed, the order book is dynamic. Shifts in the size of orders at specific levels can indicate changes in trader intentions. For example, if a substantial number of buy orders appear just below the current market price, this may suggest an area of potential support where demand could absorb selling pressure.
However, it is important to recognize that not all visible orders reflect firm commitment. Some participants adjust orders rapidly in response to changing conditions. Therefore, traders often focus not only on visible depth but also on how price reacts when tested. If price repeatedly approaches a level with substantial resting orders and fails to move beyond it, that level may represent meaningful supply or demand.
The order book also reveals the sequence of price levels available for execution. Thin books, where few orders are posted at each level, are more susceptible to sharp price moves because relatively small market orders can move price significantly. In contrast, deep books with substantial liquidity at multiple levels tend to exhibit smoother price transitions.
Bid and Ask Components
The bid price represents the highest price a buyer is currently willing to pay for an asset, while the ask price represents the lowest price at which a seller is willing to sell. The difference between these two, known as the bid-ask spread, reflects immediate transaction cost and market liquidity.
In highly liquid markets such as major currency pairs or leading equity indices, the spread is typically narrow. This indicates that there is substantial competition among buyers and sellers, and transactions can occur with minimal price concession. In less liquid markets, the spread may widen, signaling reduced immediacy and higher implicit trading cost.
Changes in the spread can provide information about market conditions. A widening spread may suggest uncertainty or reduced liquidity, often occurring during major economic announcements or outside regular trading hours. A tightening spread may indicate heightened participation and confidence among market makers.
Monitoring how the bid and ask evolve over time allows traders to identify short-term pressure. For example, if the bid continually moves higher while the ask remains relatively stable, buyers may be gaining ground. Conversely, if the ask repeatedly drops while bids retreat, sellers may be pressing the market lower.
Using Order Flow in Trading Strategies
Order flow can be integrated into discretionary trading strategies in several ways. Rather than replacing traditional analysis methods such as chart patterns or trend analysis, order flow often complements them by providing confirmation or early warning signals. A trader who identifies a potential breakout on a price chart may look to order flow data to confirm that aggressive buying or selling is supporting that move.
Tracking large orders is a common application. When significant buy or sell orders enter the market and result in substantial executed volume, they can signal participation by institutional actors. Such participation may lead to sustained price movement if it reflects broader portfolio adjustments or strategic positioning.
Another strategic application involves observing absorption. Absorption occurs when aggressive market orders are consistently met by substantial resting limit orders at a specific price level, preventing further movement. For example, repeated instances of strong selling into a price level that fails to break lower may indicate hidden demand. This dynamic can precede a reversal if sellers exhaust themselves without pushing price further.
Order flow analysis also aids in identifying shifts from balance to imbalance. Markets often rotate within a range as buying and selling pressure alternate. When one side begins to dominate and consumes liquidity across multiple levels, it may signal a transition from consolidation to directional movement. Recognizing this transition in real time can provide advantageous entry or exit timing.
Volume Analysis
Volume is closely tied to order flow, as it represents the quantity of units traded over a given period. While traditional volume indicators show aggregated totals per bar or session, order flow tools can display volume at specific price levels. This granular view reveals where the majority of trading activity has occurred.
High trading volume at a particular price may signal agreement between buyers and sellers regarding value, potentially forming areas of support or resistance. Conversely, rapid price movement accompanied by relatively low volume may indicate limited participation, raising the possibility of retracement.
Volume imbalances can also be examined within individual price bars. If significantly more contracts trade at the ask than at the bid within a given period, aggressive buyers may be exerting pressure. Sustained imbalances over consecutive bars may reinforce the likelihood of continuation in that direction.
Another aspect of volume analysis involves identifying climactic activity. Sudden surges in volume combined with accelerated price movement can indicate capitulation or exhaustion. For instance, a sharp decline accompanied by exceptionally high volume may reflect panic selling that could eventually deplete available sellers. Monitoring how order flow behaves after such events helps determine whether a reversal or continuation is more probable.
Detecting Market Manipulation
Order flow analysis can assist in recognizing irregular trading behavior. One known tactic is spoofing, where a trader places large limit orders with no intention of execution, aiming to create the impression of strong demand or supply. These orders are often canceled shortly before they would otherwise be filled.
By observing patterns in the order book, traders may detect inconsistencies such as large orders that appear and disappear repeatedly without resulting in trades. While not all canceled orders constitute manipulation, repetitive patterns at key price levels can suggest attempts to influence perception.
Another technique involves layering, where multiple large orders are placed at different price levels to exaggerate apparent depth. Careful monitoring of actual executed trades compared to displayed depth can help differentiate genuine liquidity from transient orders. Markets with strong regulatory oversight attempt to limit such behavior, but awareness remains important for active participants.
It is essential, however, to approach conclusions cautiously. The rapid adjustment of orders is a normal aspect of electronic trading, especially among algorithmic participants managing risk dynamically. Therefore, detecting manipulation should rely on consistent patterns rather than isolated events.
Conclusion
Order flow analysis centers on the real-time interaction between buyers and sellers and the mechanics by which trades occur. By studying how market orders consume liquidity, how limit orders supply it, and how the order book evolves, traders gain a structured understanding of price development. Observing the bid and ask, monitoring volume at specific price levels, and identifying shifts in aggression or absorption contribute to a more nuanced interpretation of supply and demand.
For discretionary traders, incorporating order flow into an existing framework can refine timing, improve trade selection, and support risk management decisions. Instead of relying solely on historical price patterns, traders can evaluate whether current participation aligns with their expectations. Over time, consistent observation of order flow can enhance familiarity with normal versus abnormal behavior in a given market.
Many trading platforms provide access to order book data, time-and-sales information, and volume profiling tools. By studying these resources systematically and applying disciplined analysis, traders can develop a comprehensive perspective on market structure and execution dynamics.
This article was last updated on: July 14, 2026